You can style the table using CSS, which keeps markup to a minimum and allows you to control your data table’s appearance from the style sheet. You can create a .css file by following the next steps:
1. You can provide a basic rule for <p>, <td> and <th> tags which is appears in the style sheet of any CSS-styled site:
p, td, th {
font: 1.0em Arial, Geneva, Helvetica, sans-serif;
}
2. You can style the table as a whole:
.datatable {
border: 2px solid #D6DDE6;
border-collapse: collapse;
}
Note: This CSS code displays a border around the outside of the table, while border-collapse will remove spaces between that table’s cells.
3. You can style the table cells with the next code:
.datatable td {
border: 2px solid #D6DDE6;
text-align: right;
padding: 4px;
}
4. With the next CSS code you can add a border to the <th> (heading) cells. You can use a darker color for this border, and you can also add a background color to these cells to highlight the fact that they’re headings, not regular cells.
.datatable th {
border: 2px solid #828282;
background-color: #BCBCBC;
font-weight: bold;
text-align: left;
padding: 4px;
}
5. You can style the the caption to make it look like part of the table:
.datatable caption {
font: bold 1.2em “Times New Roman”, Times, serif;
background-color: #B0C4DE;
color: #33517A;
padding-top: 3px;
padding-bottom: 2px;
border: 1px solid #789AC6;
}
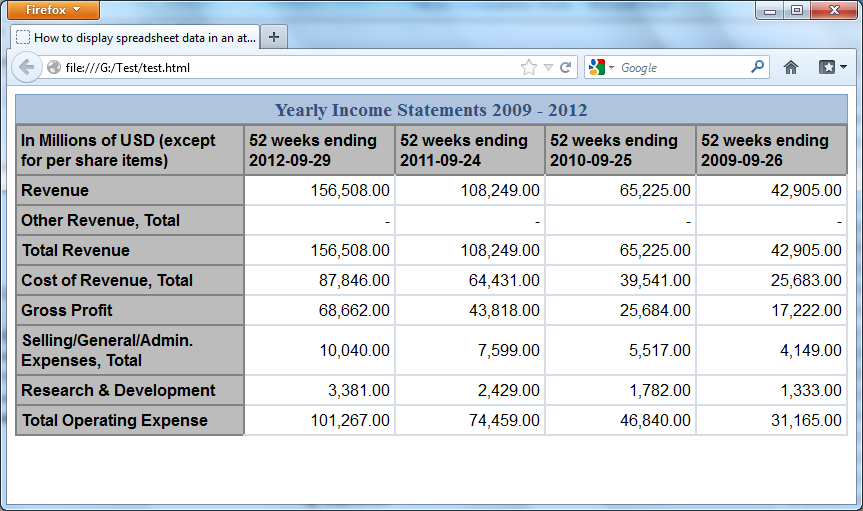
By applying the rules with the next test file, you will receive a result shown in the next picture:
File test.html
<!DOCTYPE html PUBLIC “-//W3C//DTD XHTML 1.0 Strict//EN”
“https://www.w3.org/TR/xhtml1/DTD/xhtml1-strict.dtd”>
<html xmlns=”https://www.w3.org/1999/xhtml” lang=”en-US”>
<head>
<title>How to display spreadsheet data in an attractive and usable way with CSS</title>
<meta http-equiv=”content-type” content=”text/html; charset=utf-8″ />
<link rel=”stylesheet” type=”text/css” href=”test.css” />
</head>
<body>
<table class=”datatable” summary=”This table shows Apple Inc. Annual Data for years 2009 through 2012″>
<caption>Yearly Income Statements 2009 – 2012</caption>
<tr>
<th scope=”col”>In Millions of USD (except for per share items)</th>
<th scope=”col”>52 weeks ending 2012-09-29</th>
<th scope=”col”>52 weeks ending 2011-09-24</th>
<th scope=”col”>52 weeks ending 2010-09-25</th>
<th scope=”col”>52 weeks ending 2009-09-26</th>
</tr>
<tr>
<th scope=”row”>Revenue</th>
<td>156,508.00</td>
<td>108,249.00</td>
<td>65,225.00</td>
<td>42,905.00</td>
</tr>
<tr>
<th scope=”row”>Other Revenue, Total</th>
<td>-</td>
<td>-</td>
<td>-</td>
<td>-</td>
</tr>
<tr>
<th scope=”row”>Total Revenue</th>
<td>156,508.00</td>
<td>108,249.00</td>
<td>65,225.00</td>
<td>42,905.00</td>
</tr>
<tr>
<th scope=”row”>Cost of Revenue, Total</th>
<td>87,846.00</td>
<td>64,431.00</td>
<td>39,541.00</td>
<td>25,683.00</td>
</tr>
<tr>
<th scope=”row”>Gross Profit</th>
<td>68,662.00</td>
<td>43,818.00</td>
<td>25,684.00</td>
<td>17,222.00</td>
</tr>
<tr>
<th scope=”row”>Selling/General/Admin. Expenses, Total</th>
<td>10,040.00</td>
<td>7,599.00</td>
<td>5,517.00</td>
<td>4,149.00</td>
</tr>
<tr>
<th scope=”row”>Research & Development</th>
<td>3,381.00</td>
<td>2,429.00</td>
<td>1,782.00</td>
<td>1,333.00</td>
</tr>
<tr>
<th scope=”row”>Total Operating Expense</th>
<td>101,267.00</td>
<td>74,459.00</td>
<td>46,840.00</td>
<td>31,165.00</td>
</tr>
</table>
</body>
</html>

