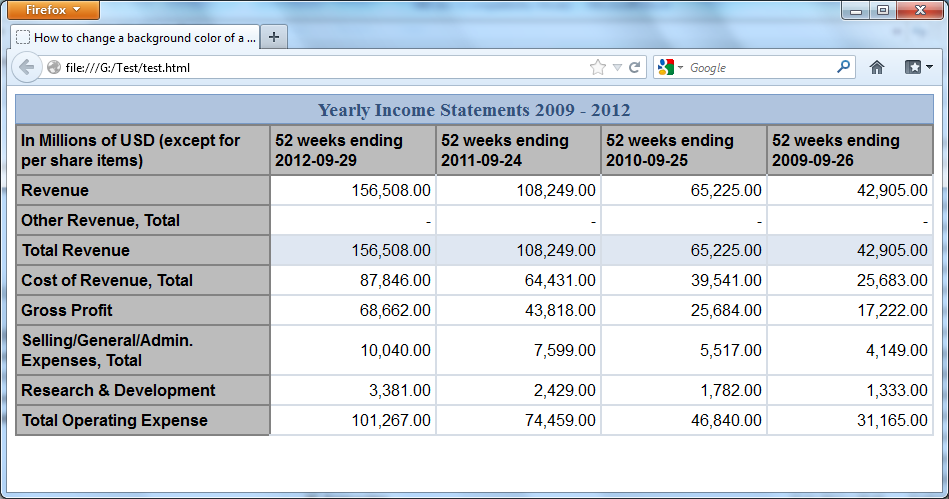
You can improve readability of data which is in table by changing the color of row when users mouse over it, to highlight the row they are reading. For example you can add the next additional CSS rule to the set of rules described in the article How to display spreadsheet data in an attractive and usable way with CSS:
.datatable tr:hover {
background-color: #DFE7F2;
color: #000000;
}
In this case if you use the next test file, the result is shown in the picture:
File test.html
<!DOCTYPE html PUBLIC “-//W3C//DTD XHTML 1.0 Strict//EN”
“https://www.w3.org/TR/xhtml1/DTD/xhtml1-strict.dtd”>
<html xmlns=”https://www.w3.org/1999/xhtml” lang=”en-US”>
<head>
<title>How to change a background color of a row from a table on hover with CSS</title>
<meta http-equiv=”content-type” content=”text/html; charset=utf-8″ />
<link rel=”stylesheet” type=”text/css” href=”test.css” />
</head>
<body>
<table class=”datatable” summary=”This table shows Apple Inc. Annual Data for years 2009 through 2012″>
<caption>Yearly Income Statements 2009 – 2012</caption>
<tr>
<th scope=”col”>In Millions of USD (except for per share items)</th>
<th scope=”col”>52 weeks ending 2012-09-29</th>
<th scope=”col”>52 weeks ending 2011-09-24</th>
<th scope=”col”>52 weeks ending 2010-09-25</th>
<th scope=”col”>52 weeks ending 2009-09-26</th>
</tr>
<tr>
<th scope=”row”>Revenue</th>
<td>156,508.00</td>
<td>108,249.00</td>
<td>65,225.00</td>
<td>42,905.00</td>
</tr>
<tr>
<th scope=”row”>Other Revenue, Total</th>
<td>-</td>
<td>-</td>
<td>-</td>
<td>-</td>
</tr>
<tr>
<th scope=”row”>Total Revenue</th>
<td>156,508.00</td>
<td>108,249.00</td>
<td>65,225.00</td>
<td>42,905.00</td>
</tr>
<tr>
<th scope=”row”>Cost of Revenue, Total</th>
<td>87,846.00</td>
<td>64,431.00</td>
<td>39,541.00</td>
<td>25,683.00</td>
</tr>
<tr>
<th scope=”row”>Gross Profit</th>
<td>68,662.00</td>
<td>43,818.00</td>
<td>25,684.00</td>
<td>17,222.00</td>
</tr>
<tr>
<th scope=”row”>Selling/General/Admin. Expenses, Total</th>
<td>10,040.00</td>
<td>7,599.00</td>
<td>5,517.00</td>
<td>4,149.00</td>
</tr>
<tr>
<th scope=”row”>Research & Development</th>
<td>3,381.00</td>
<td>2,429.00</td>
<td>1,782.00</td>
<td>1,333.00</td>
</tr>
<tr>
<th scope=”row”>Total Operating Expense</th>
<td>101,267.00</td>
<td>74,459.00</td>
<td>46,840.00</td>
<td>31,165.00</td>
</tr>
</table>
</body>
</html>

